- EU gross box office totalled EUR 7.02 billion in 2017, just 0.3% down on 2016
- Family franchise hits Despicable Me 3 and Beauty and the Beast led the EU charts
- Market share for European films grew to 27.5%
- EU film production growth came to halt as production volume went down to 1 676 feature films
- Digital screen penetration in the EU reached 93%
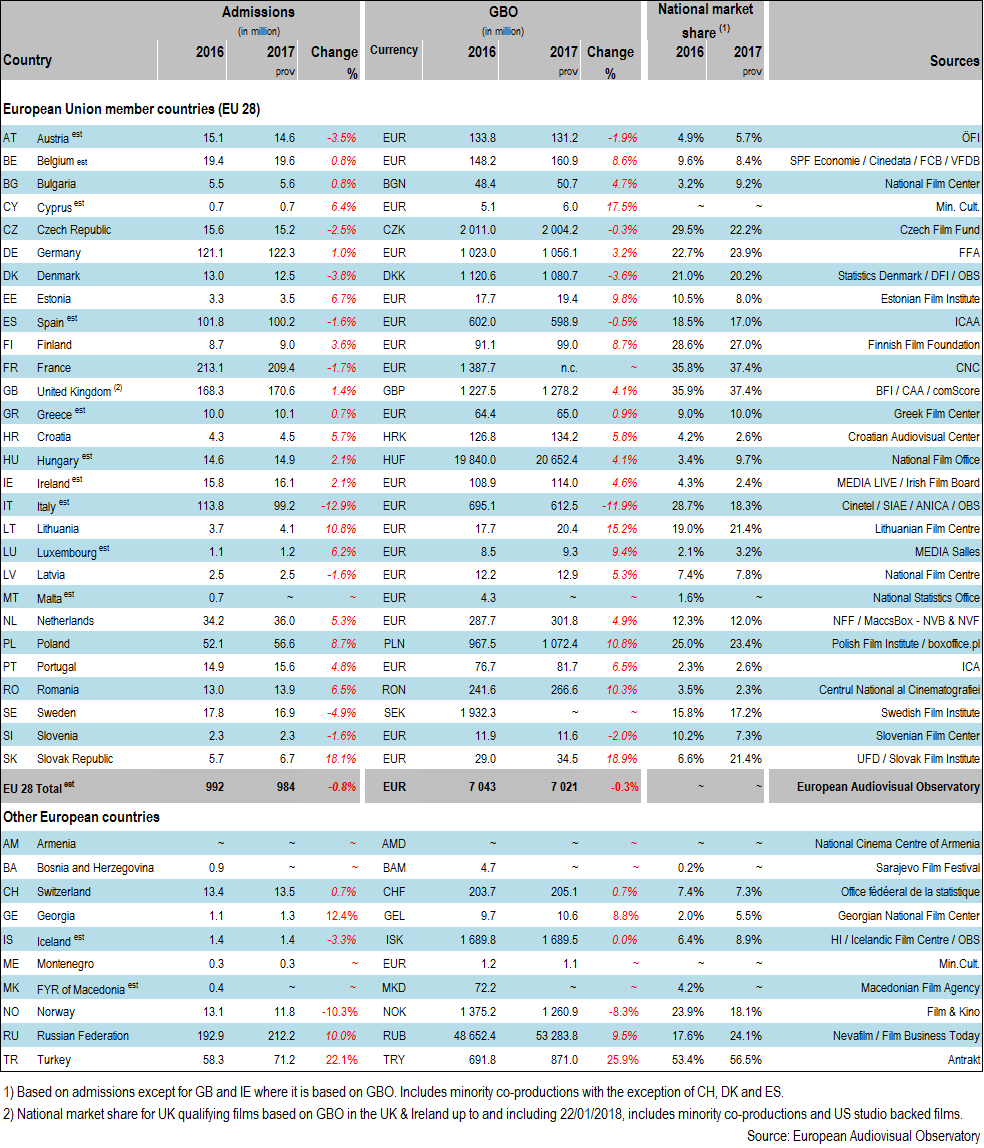
EU gross box office held steady above EUR 7 billion in 2017
Based on provisional data, cumulative GBO in the EU Member States topped the EUR 7 billion benchmark once again, reaching an estimated EUR 7.02 billion in 2017. While dropping 0.3% on the previous year, this still represents – not adjusted for inflation – the third highest level ever recorded. With the pan-European average ticket price stable at an estimated EUR 7.1, the decrease in GBO was mainly driven by a slight decline in cinema attendance, as admissions dropped 0.8% to a total of 984 million (-7.6 million tickets sold), still marking the third highest level in the EU since 2004. Measured in local currencies, GBO grew in an uneven manner across the EU, as it increased in 19 and decreased in 6 of the 25 EU markets for which provisional data were available. Geographically speaking, GBO growth was strong in Central and Eastern Europe, recording a solid upturn in the Slovak Republic (+EUR 5.5 million, +18.9%), Lithuania (+EUR 2.7 million, +15.2%), Poland (+PLN 104.9 million, +10.8%) and Romania (+RON 25.0 million, +10.3%). Out of the five major EU markets, a moderate rise in the GBO was registered in Germany (+EUR 33.1 million, +3.2%) and the UK (+GBP 50.7 million, +4.1%), while revenues remained relatively stable in France and Spain.
“In turn, Italy showed a significant dip in GBO (-EUR 82.6 million, -11.9%), driven by a sizeable downturn in admissions, primarily to national films. GBO revenues also dropped slightly in Denmark (-DKK 39.9 million, -3.6%) and Austria (-EUR 2.6 million, -1.9%).”
Outside the EU, Russian GBO soared by 9.5% to RUB 53 283.8 million, boosted by an unprecedented increase in cinema attendance (+10.0% to 212.2 million tickets sold), and this made Russia the biggest European market in terms of admissions last year. In Turkey, GBO takings increased 25.9%, rising to a record-breaking TRY 871.0 million, driven by an exceptional growth in ticket sales (+22.1%).
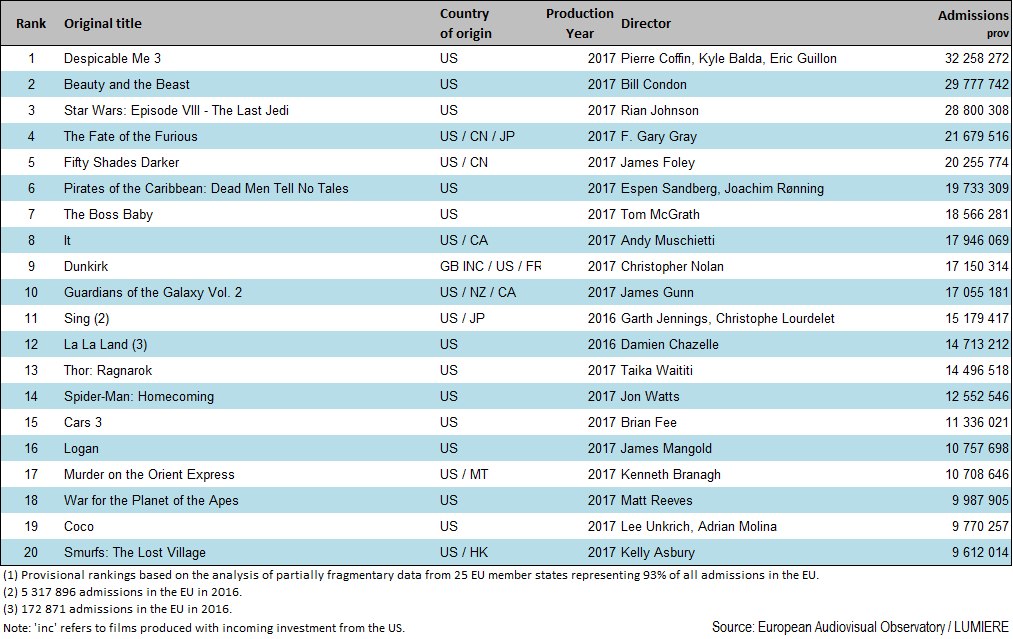
Family animated film Despicable me 3 topped the European Union chart in 2017
As in previous years, US studio titles dominated the EU box office chart, representing 19 out of the top 20 films in 2017. The list was topped by the franchise animation film Despicable Me 3 (32.3 million admissions), followed by Disney’s live action reboot of Beauty and the Beast (29.8 million) and Star Wars: Episode VIII – The Last Jedi (28.8 million). Interestingly, Despicable Me 3 was the only title to cross the benchmark of 30 million admissions, while no film had touched this threshold in 2016. Family animation features continued to perform well, accounting for six out of the top 20 titles, including The Boss Baby (18.6 million admissions), Sing (15.2 million), Cars 3 (11.3 million) and Coco (9.8 million). Confirming another well-established trend, franchise titles dominated the EU charts in 2017, as 15 titles out of the top 20 (and 8 titles out of the top 10) are reboots, sequels or spin-offs, such as The Fate of the Furious (21.7 million admissions), Fifty Shades Darker (20.3 million), Pirates of the Caribbean: Dead Men Tell No Tales (19.7 million) and It (17.9 million).
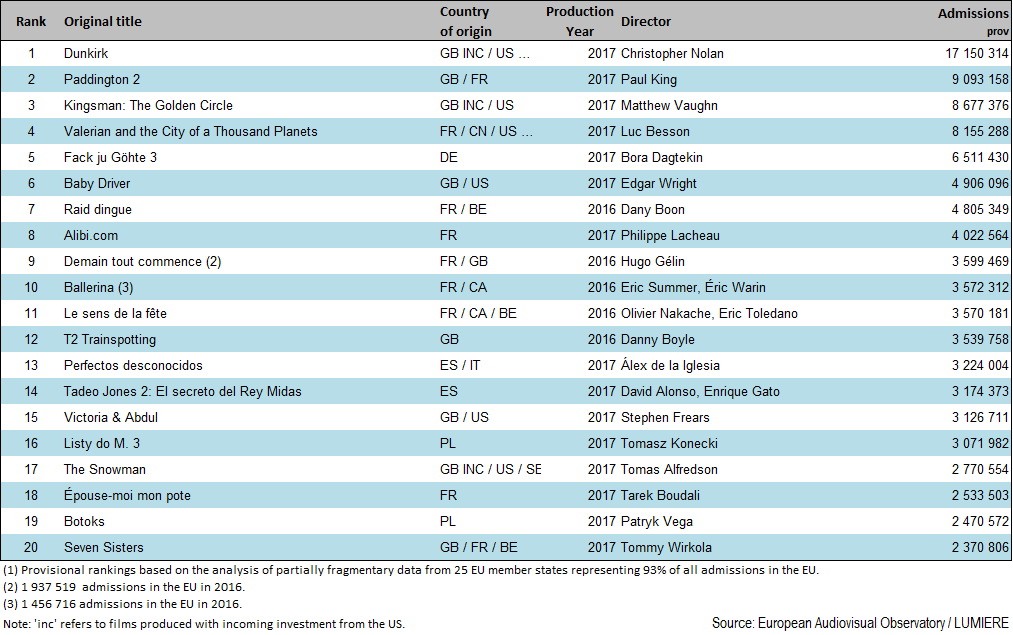
GB inc war drama Dunkirk was the only non-US film to rank in the top 20, with 17.2 million tickets sold. Excluding European films financed with incoming US investment (EUR inc), no European title reached 10 million admissions in the EU with the top performing European film, UK family comedy Paddington 2 generating 9.1 million admissions.
Table 1: GBO, admissions and national market share in European countries 2016 – 2017 prov
Table 2: Top 20 films by admissions in the European Union in 2017 prov (1)
Table 3: Top 20 European films by admissions in the European Union in 2017 (incl. “EUR inc”) prov (1)
European market share rose to 27.5%
In 2017, cumulative admissions to US films decreased leading to an estimated US market share of 66.2%, down from 67.5% of the previous year. Conversely, admissions to European films slightly increased in 2017, making the market share of European films rise from 26.3% to an estimated 27.5%, the second highest level in the past five years. The market share of European films produced with incoming US investment (EUR inc) remained relatively stable at 3.7% (compared to 3.5% in 2016).
Table 4: EU market share by country of origin 2013 – 2017 prov
In % of total admissions. Provisional estimates.
EU film production volume registers slight decline
EU production levels showed a moderate downturn as the estimated number of European feature films produced in 2017 dropped from 1 741 to 1 676 (-3.7% down on 2016), reversing a long-established growth trend. This figure breaks down into an estimated number of 1 072 fiction films (64%) and 604 feature documentaries (36%). The decrease in production activity was primarily linked to the decreasing number of 100% national films, accounting for 68% of the total fiction production volume in 2017.
Table 5: Number of feature films produced in the European Union 2013 – 2017 prov
Digital conversion rate in the EU reaches 93%
According to figures provided by MEDIA Salles the digitisation process in the EU is almost complete. By the end of 2017 a total of 24 EU member states had converted 90% or more of their screen base with only two territories registering digital screen penetration rates below 80%: the Slovak Republic (77%) and the Czech Republic (51%)[1]. By the end of 2017 the total number of digital screens was 30 735, accounting for an estimated 93% of the EU’s total screen base.
Table 6: Digital screens in the European Union 2013 – 2017 prov
Provisional estimates.
More detailed information on European as well as international theatrical markets can be found in FOCUS 2017 World Film Market Trends prepared by the European Audiovisual Observatory for the Cannes Film Market.
[1] Czech screen base includes non-permanent screens (open-air, part-time, itinerant screens (which represent an important part of the local cinema landscape. Digital screen penetration among permanent cinemas is above 90%.
Notes for Editors:
- Data have been collected with the collaboration of the EFARN (European Film Agency Research Network).
- All 2017 figures are provisional.
The European Audiovisual Observatory, Council of Europe
Set up in December 1992, the European Audiovisual Observatory's mission is to gather and distribute information on the audiovisual industry in Europe. The Observatory is a European public service body comprised of 41 member states and the European Union, represented by the European Commission. It operates within the legal framework of the Council of Europe and works alongside a number of partner and professional organisations from within the industry and with a network of correspondents. In addition to contributions to conferences, other major activities are the publication of a Yearbook, newsletters and reports, the compilation and management of databases and the provision of information through the Observatory's Internet site.
European Union admissions rankings (Tables 2 and 3)
The pan-European film rankings shown in tables 2 and 3 are based on data from all European Union countries for which results have been stored in the LUMIERE database as of 13th April 2018. This database on admissions to films released in Europe is available on-line and free-of-charge, and is the result of collaboration between the European Audiovisual Observatory and various specialised national sources as well as the MEDIA Programme of the European Union. LUMIERE provides country-by-country analysis of admissions for about 66 000 films in distribution in Europe since 1996. Partial 2017 data for 25 European countries is now available, including data for the major European Union markets, as well as data for the North American market.
Market shares (Table 4)
The market shares shown in this figure are based on an analysis of results of films released in member states of the European Union for which admissions data for individual films are made available to the European Audiovisual Observatory. In order to draw up such market shares, a single 'country of origin' must be attributed to each film, an attribution that can prove difficult in the case of international productions. In these cases the Observatory's aim is to attribute a country of origin corresponding to the source of the majority financial input and/or creative control of the project. Since 2005 the Observatory has identified specifically films that have been produced in one or more European countries (or elsewhere) with US investment by using the reference 'inc' (incoming investment) in the country of origin attribution. It should be noted, however, that the availability of further information may occasionally lead to changes in the attribution of country of origin and that the origin of a film as attributed in the LUMIERE database may not always be identical with that indicated by national sources.
The provisional data on market shares in the European Union in 2017 shown in table 4 are based on the data on admissions to individual films as collected in the LUMIERE database on 13th April 2018. At this date the coverage rate of the database for admissions in the 25 European Union countries for which data is available was of around 93%. Due to various gaps in data collection and delivery in various countries, coverage of 100% of admissions is currently unachievable.
Number of feature films produced in the European Union (Table 5)
Estimating the total volume of production of feature films in the European Union remains difficult, chiefly due to the risk of double counting of co-productions and to differing national methodologies for the collection of this data. Included in the total for the European Union are feature-length films intended for theatrical exploitation, excluding minority co-productions and US and foreign production in the United Kingdom. For some countries no separate data are available for feature fiction and feature documentary films.
The European Audiovisual Observatory
will be present at the Marché du Film, Cannes
Stand 19.08 Level 01
Palais des Festivals
Tel.: 33 (0) 4 92 99 81 19
More detailed information can be found in
FOCUS 2018 World Film Market Trends
Compiled by the European Audiovisual Observatory and published by the Marché du Film.
Our FOCUS publication will be on sale via our online shop
We will also be selling it on our stand in Cannes


