
Download "Top players in the European audiovisual industry – ownership and concentration” (2023 Edition) here
The European Audiovisual Observatory, part of the Council of Europe in Strasbourg, has published a new edition of its annual report on key AV players in Europe. This report, Top players in the European audiovisual industry - ownership and concentration, was authored by Laura Ene Iancu, Analyst within the Observatory’s Department for Market Information.
The report aims at shedding light on the structure of the AV industry in Europe in terms of revenues as well as other performance indicators specific to key audiovisual market segments. The analysis provides snapshots of the top AV players and explores concentration, statute, and origin of ownership by revenues, pay-AV subscriptions, number of AV services, TV audiences and number of TV fiction titles. It also provides transversal views for players active in more than one market segment.
This 3rd edition of the report introduces case studies illustrating the diversity of national audiovisual landscapes in Europe.
Download links to all top lists in an excel format are included in the report and all rankings include more than the first 20 leading players of each specific AV market segment presented in the report pages. The revenue analysis in this report covers the timeframe from 2016 to 2022.
The report finds that at the end of 2022:
- The top 100 audiovisual groups in Europe by revenue grew twice as fast as the overall AV service market revenues between 2016 and 2022.
- Private and US interests in the cumulated operating revenues of the top 100 audiovisual groups went up between 2016 and 2022.
- Private sector revenues were almost equally banked by both European and US-backed players.
- Telco-driven players (i.e packagers/distributors) cumulatively accounted for over 70% of the pay-TV subscriptions.
- Pure SVOD platforms lost weight as subscriptions signed off to broadcaster-controlled streamers which picked up pace year-on-year.
- Concentration levels across the top three SVOD players went down year-on-year.
- The AV market structure paints a highly eclectic picture in Europe based on country-specific realities and the way players choose to apply their portfolios to serve different territories.
Top 100 players in Europe
The cumulated operating revenues of the top 100 audiovisual groups in Europe grew twice as fast in 2022 (+23% as compared to 2016) as the AV service revenues for the overall market and at a higher pace than that of average inflation.
The cumulative evolution of the top 100 revenues was mainly organic, with 90% of the growth accounted for by the private sector and almost entirely concentrated on the top 20 private groups. Pure SVOD players alone, such as Netflix, Amazon Prime Video, DAZN and Apple TV+ fueled the top 100 player dynamic. Their cumulated revenues grew by a factor of 6 in 2022 compared to 2016. In contrast to the overall evolution of traditional market segments, in top 100, revenues of primarily traditional players also registered an increase (+14% over 2016) driven mainly by Warner. Bros Discovery, Paramount, Comcast’s Sky, Disney, Vodafone, and Deutsche Telekom. In part, this evolution might also be explained by a stronger dynamic in revenue streams generated outside traditional AV service activity.
Top 20 European AV groups by operating revenues (2022 - in mEUR)
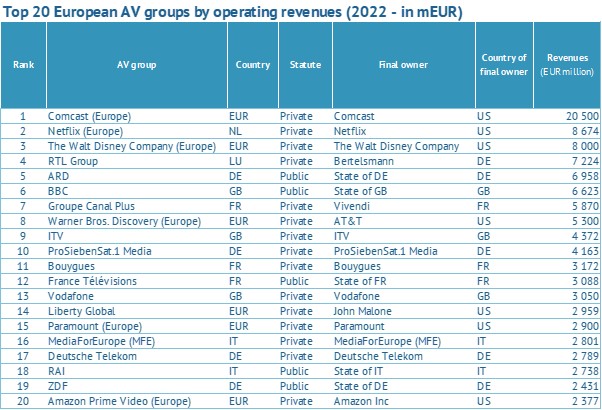
Consolidated operating revenues for top 100 European groups active in the video business. On a best-effort basis, for telco players and US powerhouses, the analysis covers mainly revenues derived from media and production segments. Groups not included: 1) groups mainly providing telecommunication services without details on video revenues; 2) groups mainly active in distribution of audiovisual works; 3) radio groups not active in the video business; 4) groups providing transmission facilities for audiovisual services; 5) cinema chains; 6) groups mainly active in gaming.
Source: European Audiovisual Observatory
These developments saw the private share in general and US weight in particular go up in 2022 over 2016.
Among the top 100 players, private groups saw their cumulated revenue weight go up to 73% in 2022 (+4% over 2016). Broadcasters took the lion’s share (68%), followed by telco-driven companies (20%) and pure SVOD players (12%). Private sector revenues were almost equally banked by both European and US-backed players.
The weight of US interests in the top 100 revenues went up to 36% in 2022 (+5% over 2016) due to the rise of the pure SVOD players, but also of the SVOD services of US-backed broadcasters such as Sky, Paramount+, HBO Max and Disney+. Up to 70% of US interests were cumulated by broadcasters and 25% by pure SVOD platforms. Sky alone accounted for one third of revenues cumulated by US-backed players.
Concentration levels remained largely the same among the top 100 European AV groups by operating revenues over the analysed period. The top 20 players accumulated 73% of top 100 revenues in 2022, a slight increase compared to the 71% registered in 2016. Regarding consolidations taking place among private players already present in the top 100, and organic growth, the strong are getting stronger.
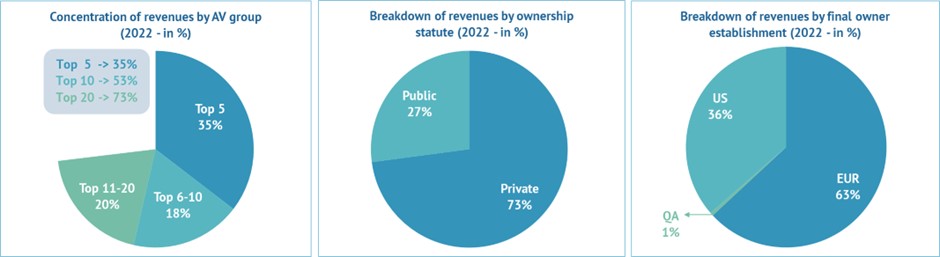
Source: European Audiovisual Observatory
Pay-TV and SVOD players in Europe
The pay-TV market structure remained unchanged in 2022 with regards to concentration levels, private share, and US interests, when compared to the previous year.
Telco-driven players (i.e packagers/distributors) as opposed to players driven by the edition of AV services arm, cumulatively accounted for over 70% of pay-TV subscriptions in 2022. This makes pay-TV business in Europe chiefly European-driven (81%) and almost entirely represented by the private sector (95%). With the top 10 operators cumulatively accounting for 60% of subscriptions at the end of 2022, the pay-TV market remained highly concentrated.
SVOD, the market segment with the highest share of US (84%) and private interests (99%), was also the most concentrated, with 90% of subscriptions cumulatively signed off to the top 10 OTT platforms at the end of 2022. However, the concentration level across the top three players went down in 2022 compared with 2021 due to the plateauing of new additions registered by SVOD juggernauts, Netflix and Amazon.
This happened against the backdrop of the smaller streamers scaling up, chiefly the platforms of the US powerhouses (i.e. Paramount, WBD and Disney) which saw their cumulative subscriptions hike by +68% in 2022 over 2021. With OTT subscriptions signed off to European broadcasters also registering high dynamics (up by +41% in 2022 over 2021), the overall weight of broadcasters gained 9% (up to 40% in 2022), while the market share of pure SVOD platforms dropped to 57% in 2022 (down by -8% over 2021).
When considering all subscriptions signed off to top players owning - as opposed to only distributing - at least one prominent pay-TV channel or SVOD platform in 2022, US powerhouses contributed over half of the incremental cumulated by the categories of players which registered growth. This saw the weight of US powerhouses go up to 21% in 2022, adding +6% to their market share over 2021.
Top 20 European AV groups owning at least one prominent pay-TV channel or SVOD platform by number of pay-AV service subscriptions (2022 - in thous.)
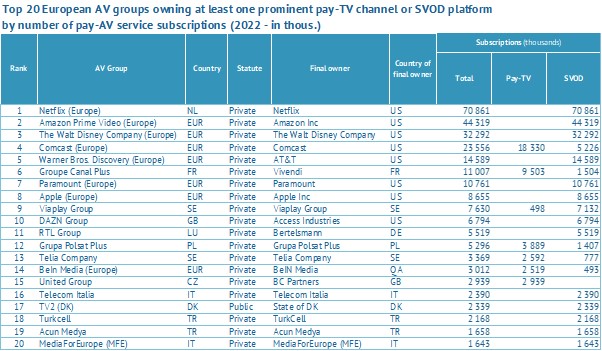
Note: for Telco groups, only SVOD subscriptions have been considered; as opposed to Broadcasters, the Telcos do not own prominent pay-TV channels, they are only involved in their distribution
Source: European Audiovisual Observatory
Pan-European vs. national AV market
AV players in Europe are highly heterogeneous in terms of their portfolio of activities. On top of this, they tailor the deployment of their portfolio to the market realities of each national territory in which they operate.
The consequence of this double-layered diversity is a wide pallet of audiovisual market structures ranging from one country to another and very different from the average pan-European one. This translates into country-specific levels of concentration, PSM involvement and US interest for a particular AV market segment.
Examples of national AV markets: Romania, the Netherlands and Finland
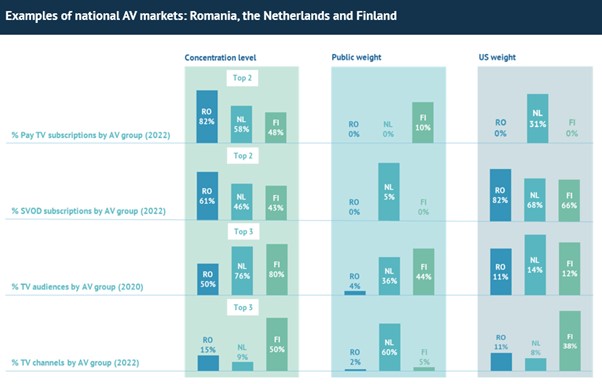
Source: European Audiovisual Observatory