Take a tour of the Yearbook 2018/2019 here.
Main insights of the Yearbook edition 2018/2019:
1. No evidence of cord-cutting in Europe for the moment
- Total number of households subscribing to pay-TV continues to increase
- IPTV share of pay-TV subscribers up to 25%
- Cable stagnating over the last five years, and satellite growth comes to a halt.
Subscribers to pay-TV in Europe – in thousand
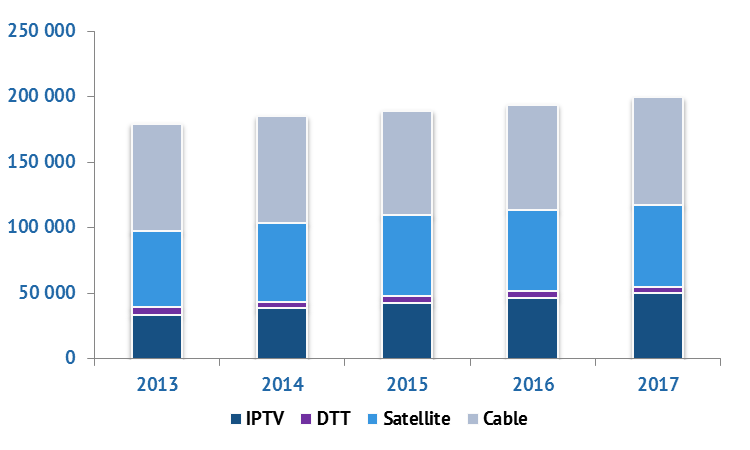
Source: European Audiovisual Observatory analysis of Ampere Analysis data
2. US groups account for 72% of the top 50 audiovisual groups revenues
- This is a massive leap, given that US groups’ share was only 66% in 2012
- The top 50 audiovisual groups cumulated revenues grew at an annual rate of 10%, much higher than the market, due to permanent consolidation
- Netflix ranks n°15 in the top 50
Cumulated revenues of the top 50 audiovisual groups by region of origin – in bn EUR
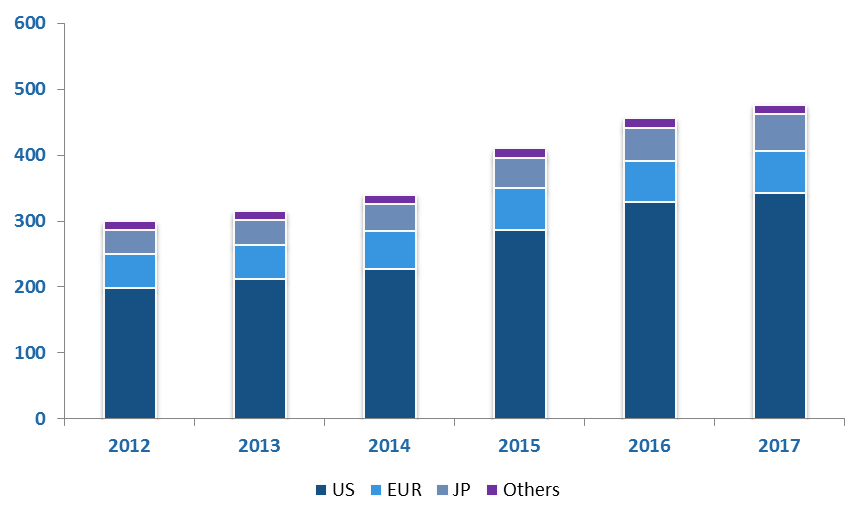
Source: European Audiovisual Observatory analysis of Ampere Analysis data
3. Television viewing is slowly decreasing – Romania tops the European viewing charts
- Daily viewing time ranges from 1h41mn in Iceland to 5h46mn in Romania
- On average, television viewing in Europe declined by 0.3% per year between 2012 and 2017.
- Sharpest decline in Iceland, Denmark, Latvia, Norway and the United Kingdom
Average daily television viewing per person in Europe – in hh:mm
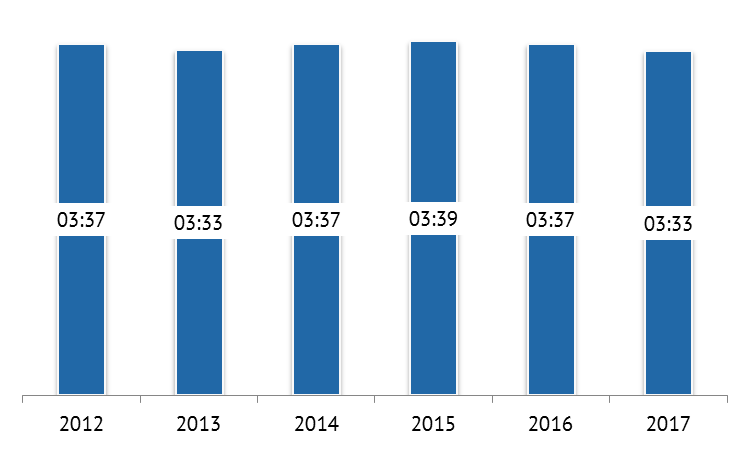
Source: European Audiovisual Observatory analysis of Eurodata TV data
4. Blu-ray joins DVD in fast decline
- On average, the physical video market declined by 14% per year between 2013 and 2017
- DVD (–16%) declined faster than Blu-ray (-7%)
- Rental accounts for 6% of the total market, vs. 11% in 2013
Physical video market in Europe – in bn EUR
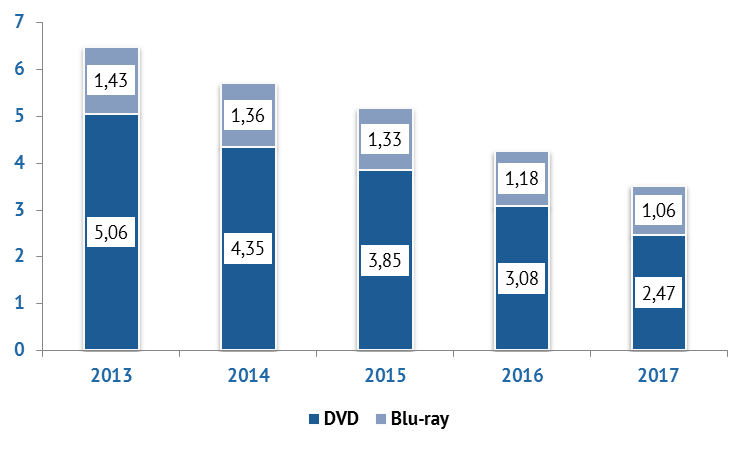
Source: European Audiovisual Observatory analysis of IHS data
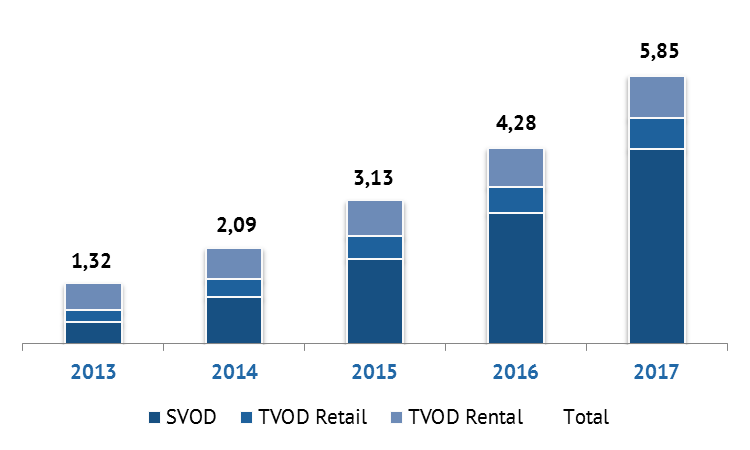
5. SVOD accounts for 72% of pay-on demand revenues
- On average, pay on-demand services grew by 45% per year between 2013 and 2017
- The main was driver for growth was SVOD, with a 74% average annual growth rate
- In TVOD, retail is growing faster than rental and accounts now for 42% of TVOD revenues
Pay on-demand revenues in Europe – in bn EUR
Source: European Audiovisual Observatory analysis of Ampere Analysis data
An executive “Key Trends” summary of the Yearbook is available free on line, and the prices for the Premium Service (including all excel tables and country profiles) can be found here.
