
Download "Top players in the European audiovisual industry – Concentration, statute, origin and profile” (2023 figures) here
The European Audiovisual Observatory, part of the Council of Europe in Strasbourg, has published a new edition of its annual report on key audiovisual (AV) players in Europe. This report, “Top players in the European audiovisual industry – Concentration, statute, origin and profile”, was authored by Laura Ene Iancu, Analyst within the Observatory’s Department for Market Information.
The report aims at shedding light on the role that top groups play in shaping the structure of the AV industry in Europe. This analysis brings to the forefront the overall performance of top players in terms of total AV market revenues. This study also explores their position with regard to the main AV market segments: public funding, pay TV, SVOD, net TV advertising and OTT advertising.
The report highlights the structure of the AV market and its key segments by looking at players’ concentration, statute, origin, as well as profile based on their core activity and market presence.
Each top 10 ranking displayed in the report features a link to a downloadable extended top ranking which also provides metadata at European group level, such as final owner, origin and statute.
To put things into perspective, the report also reviews the key M&As and their main drivers.
The report finds that at the end of 2023:
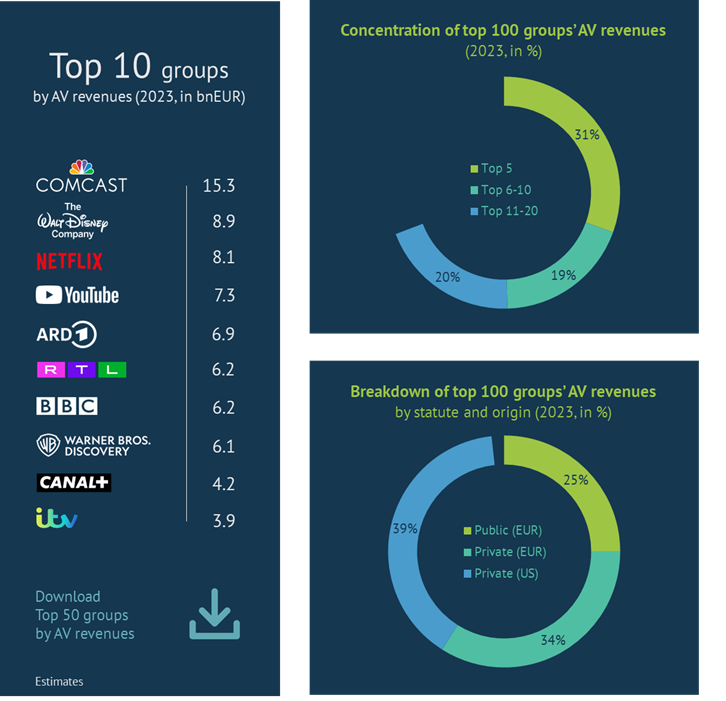
Half of the the AV revenues cumulated by top 100 groups were banked by the leading 10 players
US group Comcast was yet again the no. 1 group, accounting for 10% of the cumulated operating AV revenues of the top 100 players in Europe. Making up the same revenue weight were Netflix and YouTube, the two pure OTT platforms which made it into the top 10.
The private sector accounted for over 70% of the AV revenues of the top 100 groups, with US-backed players, significantly represented by their juggernaut studios and streaming services, taking the lion’s share.
And yet it was the European players, driven by broadcasters, who represented the majority share of the overall AV revenues cumulated by the top 100 players.
Source: European Audiovisual Observatory
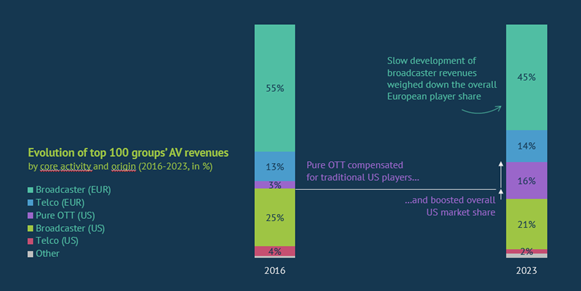
Pure OTTs boosted the US share, while telcos safeguarded the European weight in the top 100 consolidated AV revenues
Equally driven by both SVOD and VSP players, pure OTTs revenues in Europe jumped six times between 2016 and 2023 and contributed over 60% to the top 100 groups’ incremental AV revenues (up by +30% over the period analysed). The rise of pure OTT platforms pushed up the weight of US interests amid the market share drop registered by US studios, despite their proprietary streaming services such as Disney+, Paramount+, Max and Sky. European broadcasters also registered an important weight loss in AV revenues, but the good performance of telco-driven players such as Orange, DT, Telia, Telefonica, Vodafone, Altice and others helped to keep the overall European share drop to a minimum.
Source: European Audiovisual Observatory
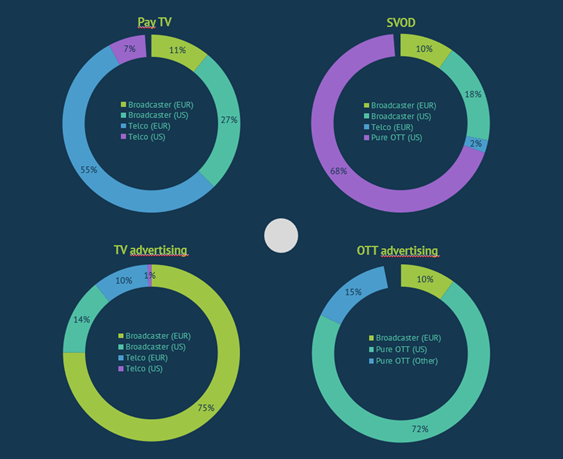
74% of traditional AV media revenues are controlled by European players, while 88% of AV new media revenues are controlled by non-European players
European players, driven by telcos, made up two-thirds of the pay-TV business and represented eight out of the top 10 pay-TV players in Europe. However, the clear pay TV frontrunner, accounting for a quarter of pay TV market revenues in Europe, was Comcast-owned Sky.
The traditional market of AV advertising was also chiefly driven by European broadcasters, which cumulatively banked 85% of the TV advertising revenues. Only three US groups ranked among the top 10 players, with TV advertising revenues driven by their European acquisitions such as that of TVN Poland by WBD, Channel 5 by Paramount’ and Sky by Comcast.
As opposed to pay TV, the SVOD market was highly represented by non-European interests, with almost 9 out of 10 euros spent on SVOD services being received by US-backed players. Pure streamers such as Netflix, Prime Video, DAZN, Youtube and Apple cumulatively accounted for 80% of the US-backed SVOD revenues, while services owned by the big US studios (i.e. Disney, WBD, Paramount and Comcast) got the remaining US interests.
90% of the OTT advertising revenues registered for both linear and on-demand AV content were banked by non-European pure OTT platforms, almost entirely represented by VSPs. Apart from the Chinese-backed TikTok, over 80% of non-European VSPs revenues were exclusively US-backed and driven by YouTube and Meta which together cumulated 2/3 of the overall OTT advertising revenues in Europe.
Breakdown of AV market segment revenues in Europe
by player’s statute and core activity profile (2023, in %)
Source: European Audiovisual Observatory
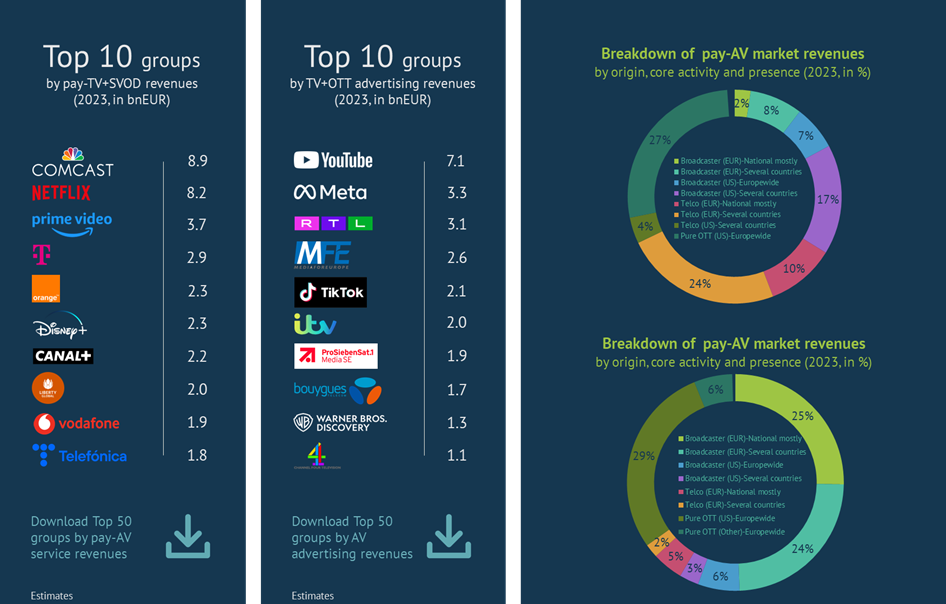
Sky and Netflix split over 30% of the pay-TV+SVOD revenues, while YouTube earned more than twice RTL’s revenues on the TV+OTT advertising market
Between the telco-driven pay-TV market and the pure OTT-driven SVOD market, the pay-AV service market was almost equally represented by broadcasters, telcos and pure streamers. Businesses focused on several territorial strongholds cumulated over half of the pay-AV service revenues. This model stands out with regard to European players, chiefly telcos, as opposed US studios and streamers which have the Europewide signature approach. European-launched Sky, and Liberty Global were the only two groups to represent US interests among players with several territorial strongholds.
Half of the total AV advertising market was controlled by European broadcasters, evenly represented by national and multi-country players. Up to 85% of TV+OTT advertising revenues were entirely complemented by non-European VSPs, typically Europewide players.
Source: European Audiovisual Observatory